Techtonic Marketing compiled ourTMCO 2025 Marketing Report to capture what’s actually working in crypto marketing right now. It compiles and analyses data from a 20-question survey completed by various Web3 organizations. The respondents represent a diverse cross-section of the blockchain and decentralized technology landscape, spanning infrastructure, DeFi, SaaS, services, and more. The findings provide a comprehensive view of how these organizations are structured, funded, marketed, and positioned for growth.
Key Highlights at a Glance
| Dominant organization type | Web3 SaaS (18.8%) |
| Dominant company stage | PMF — Product-Market Fit (43.8%) |
| Primary funding model | Venture-backed (43.8%) |
| Most common team size | 16–50 employees (43.8%) |
| Primary geographic presence | Global (68.8%) |
| Most used marketing channel | X/Twitter (93.8%) |
| Most overhyped channel | X/Twitter (56.3%) |
| Biggest marketing bottleneck | Distribution (43.8%) |
| AI usage in marketing | Core to operations (50%) |
| Overall marketing maturity | Developing (62.5%) |
Section 1: Organizational Profile
Organization Type
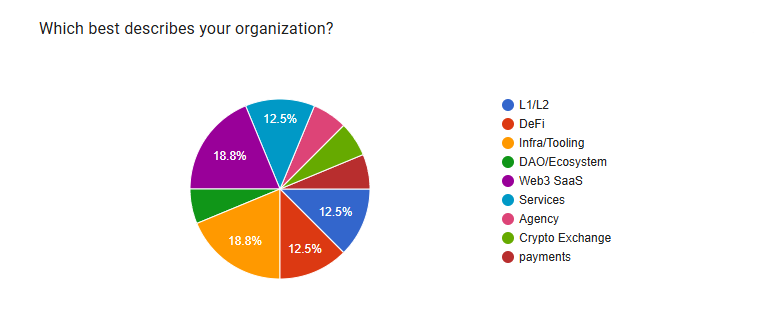
Respondents were asked to classify their organization from a list of Web3-native categories. The distribution shows a broad spread across the stack, with no single category dominating overwhelmingly. However, Web3 SaaS were the majority with 18.8% of respondents participating in the survey.
Key Observations
- Web3 SaaS is the single largest category at 18.8%, reflecting the growing trend of productized services in the blockchain space.
- Core infrastructure categories, L1/L2, DeFi, Infra/Tooling, and Services, each account for 12.5%, indicating a well-balanced representation across foundational and application layers.
- Agency, Crypto Exchange, Payments, and DAO/Ecosystem each represent approximately 6.3%, forming the tail of the distribution but covering important verticals.
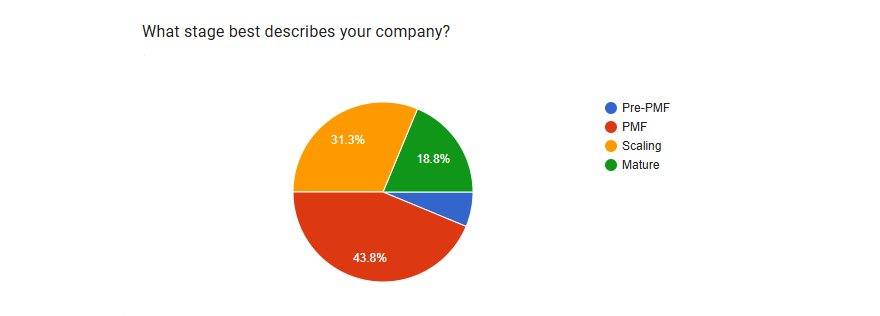
Respondents were asked to identify the stage that best characterizes their company’s current development, using a standard four-stage progression framework.
Company Stage
Key Observations
- PMF is the dominant stage at 43.8%, indicating that the majority of respondents have validated their product in the market and are consolidating traction.
- A combined 50% of respondents are in Scaling or Mature stages, suggesting the market skews toward more established, operational-phase organizations.
- Only 6.3% remain pre-PMF, indicating this survey captures organizations with real-world market engagement.
Funding Model
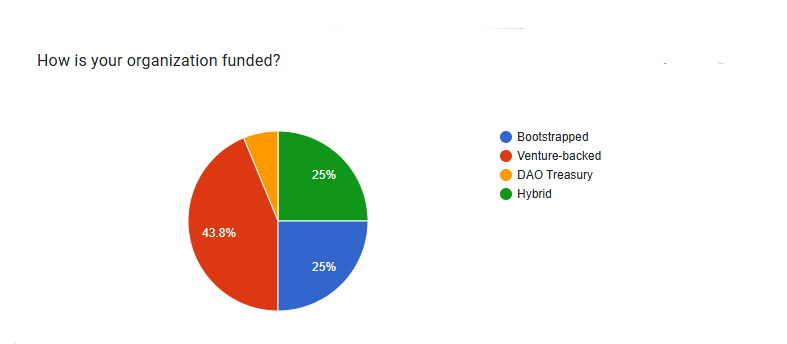
Understanding how organizations are funded helps contextualize their marketing capacity, risk appetite, and operational runway.
Key Observations
- Venture-backed organizations are at 43.8%, aligning with the broader Web3 ecosystem’s reliance on institutional capital for early growth.
- Bootstrapped and Hybrid models together account for 50%, indicating a significant portion of self-sustaining or partially independent operations.
- DAO Treasury-funded organizations represent just 6.3%, pointing out the still-early stage adoption of decentralized treasury models for operational funding.
Team Size
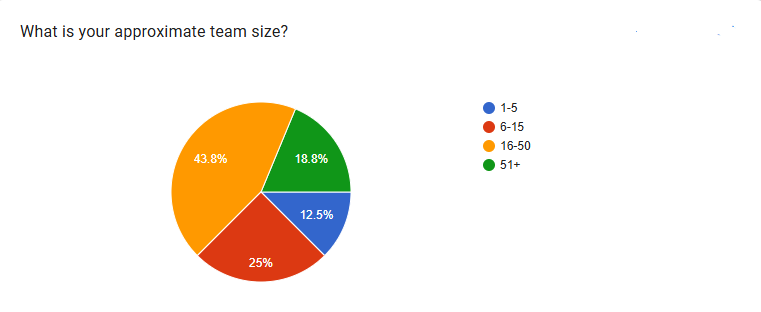
Approximate team size was captured to understand the organizational scale of respondents and the resources available for marketing and operations.
Key Observations
- The majority (43.8%) operates with 16–50 person teams, a size commonly found among scaling-phase startups with established functions.
- 25% have teams of 6–15, and 18.8% are larger organizations with 51+ employees.
- Only 12.5% have 1–5 person teams, consistent with the finding that very few respondents are pre-PMF.
Geographic Distribution
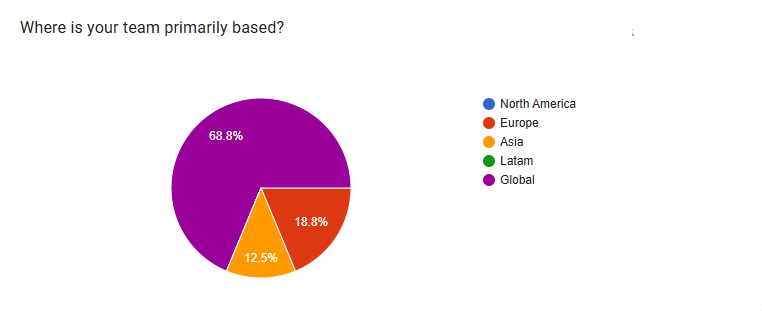
Respondents were asked where their team is primarily based out of one geographical location or spread across the world, giving insight into the global spread of Web3 operations.
Key Observations
- An overwhelming 68.8% of respondents describe themselves as globally distributed, highlighting that modern Web3 organizations largely work with remote teams.
- Europe accounts for 18.8% of location-specific respondents, followed by Asia at 12.5%.
- However, North America and Latam did not register in this sample.
Section 2: Marketing Budget & Spend
Monthly Marketing Spend
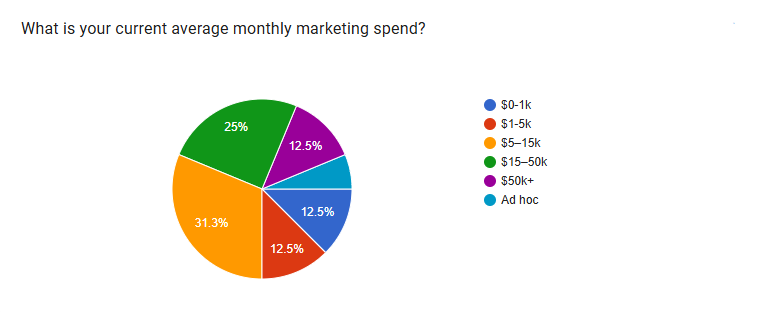
Respondents provided their approximate average monthly marketing expenditure, shining a light at the range of financial commitment to marketing activities.
Key Observations
- The report found $5–15k per month is the most common spend range at 31.3%, meaning most respondents belong to the mid-market marketing spend tier.
- 25% spend $15–50k/month, highlighting a meaningful segment with serious, funded marketing programs.
- 12.5% spend $50k+ per month, while a 6.2% operate on an entirely ad hoc basis.
Marketing Spend Pattern
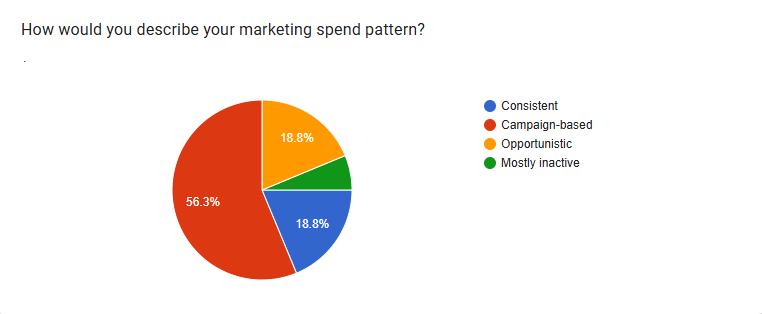
Understanding how organizations deploy their marketing budget reveals strategic preferences and operational discipline.
Key Observations
- A majority, 56.3%, operate on a campaign-based model, deploying budgets in bursts aligned with product launches, events, or market moments rather than maintaining always-on activity.
- Only 18.8% maintain a consistent marketing expenditure, suggesting that sustained, systematic marketing is still not the norm.
- 18.8% describe their approach as opportunistic, reacting to market conditions rather than following a planned calendar.
Marketing Budget Trend (Past 12 Months)
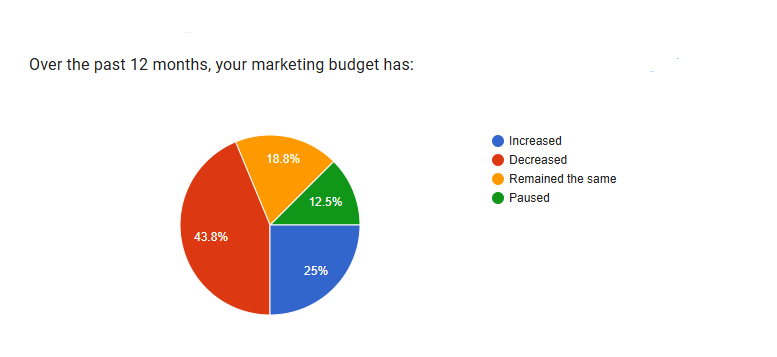
Participating indicated whether their marketing budget had changed over the preceding 12 months, an indicator of organizational health and market confidence.
Key Observations
- 43.8% of participants report a decreased marketing budget over the past year, a significant cut that reflects broader market conditions in the Web3 space.
- Only 25% saw budget increases, while 12.5% paused marketing spending entirely, a combined signal of financial caution.
- 18.8% maintained flat budgets, suggesting some stability but limited reinvestment in marketing capability.
Marketing Budget Allocation
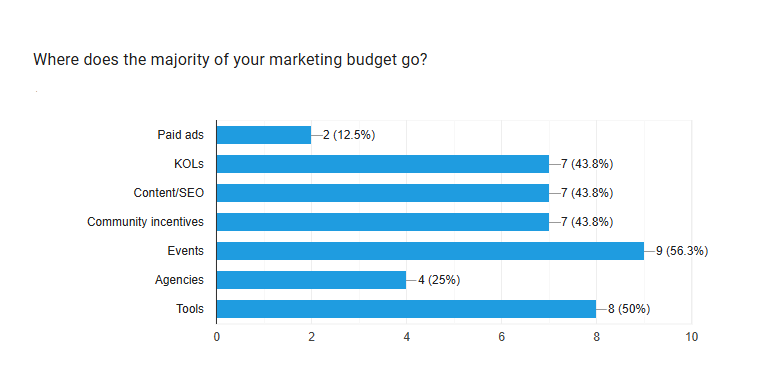
We asked participants where the majority of their marketing budget is directed. Multiple selections were allowed, and results reflect the number of respondents selecting each category.
Key Observations
- Events account for 56.3% of the budget, highlighting the importance of in-person and virtual events to Web3 go-to-market strategies.
- Tools (50%) are the second-largest allocation category, indicating investment in marketing infrastructure and automation platforms.
- KOLs, Content/SEO, and Community Incentives each attract 43.8%.
- Paid advertising remains the lowest priority at just 12.5%, consistent with Web3’s traditional preference for organic and community-led growth.
Section 3: Marketing Team & Structure
Full-Time Marketing Lead

Key Observations
- 75% of respondents have a full-time marketing lead, indicating that most organizations have made a dedicated hire for marketing ownership.
- The remaining 25% without a dedicated lead may be relying on founders or shared resources, which is consistent with the smaller team sizes previously observed.
Marketing Decision Ownership
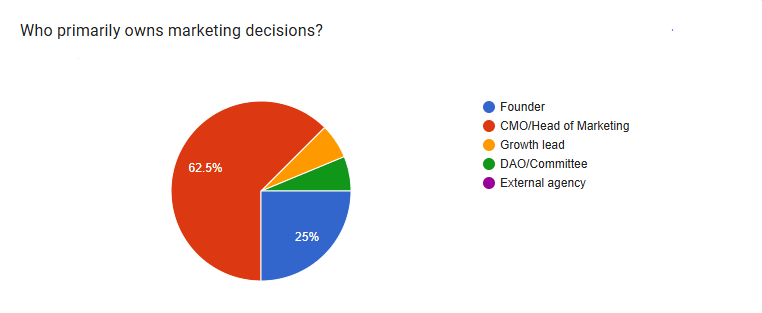
Participants were asked who primarily owns and drives marketing decisions within their organization.
Key Observations
- 62.5% of organizations have a dedicated CMO or Head of Marketing in charge of making decisions, reflecting a degree of marketing specialization and professional management.
- 25% are still founder-led in terms of marketing decisions, which is common for earlier-stage or leaner organizations.
- Only 5.5% are led by a Growth Lead and DAO. However, agency-led models are extremely rare, accounting for less than 1%.
Number of Active Marketing Contributors
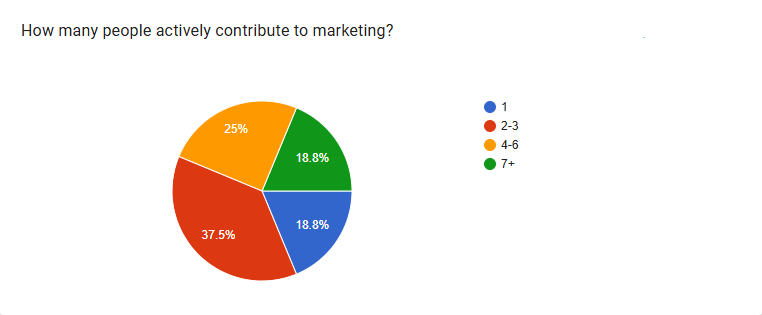
Beyond the formal lead, respondents indicated how many people actively contribute to marketing efforts.
Key Observations
- The most common marketing team size is 2–3 active contributors (37.5%).
- 18.8% operate with a single marketing contributor, while an equal 18.8% have 7+ people involved, reflecting significant variation in marketing resource allocation.
Marketing Setup Model
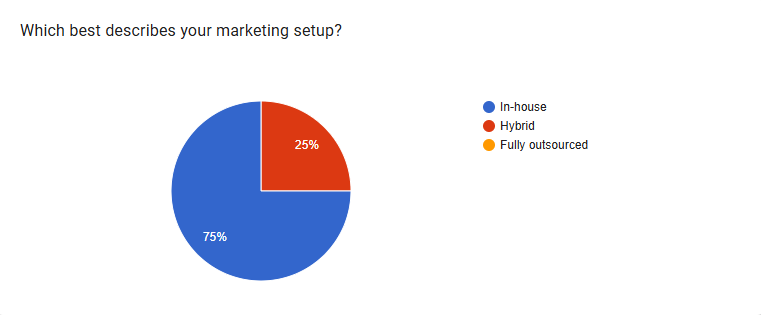
Key Observations
- 75% manage marketing fully in-house, a strong indication that these organizations value internal control, brand consistency, and community proximity.
- 25% use a hybrid model, likely supplementing internal teams with specialist agencies or freelancers.
- No respondent was fully outsourced.
Section 4: Marketing Channels
Active Marketing Channels
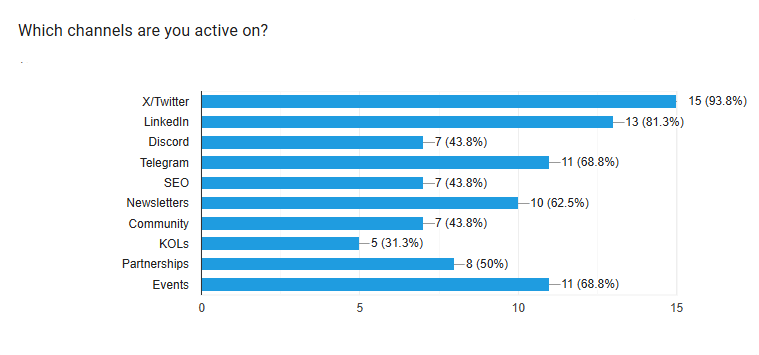
Respondents were asked to identify all channels they are currently active on. Multiple selections were permitted, and data are reported as percentages of usage for each channel.
Key Observations
- X/Twitter is near-universal at 93.8%, emphasizing its role as the primary real-time communication and community-building platform for Web3.
- LinkedIn has achieved a strong penetration at 81.3%.
- Telegram (68.8%) and Events (68.8%) are joint third, highlighting the importance of both real-time messaging and in-person touchpoints.
- Newsletters (62.5%) are also widely used.
- KOLs are the least used active channel at 31.3%, despite being a significant budget item, revealing a careful, selective deployment.
Most Undervalued / Underutilized Channels
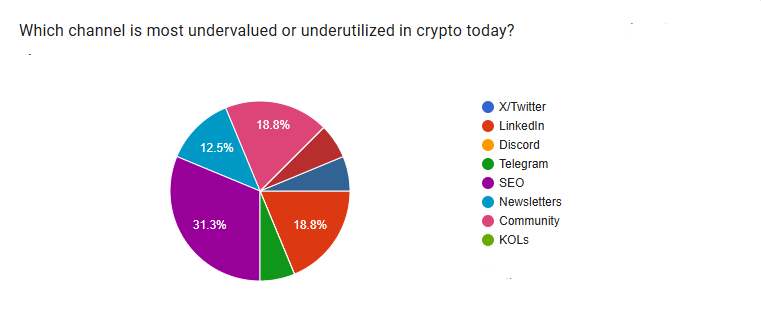
We asked participants which channels they believe is most undervalued or underutilized in the crypto space today.
Key Observations
- SEO is considered the most undervalued channel by 31.3% of participants, despite its long-term potential for organic reach.
- LinkedIn (18.8%) and Community (18.8%) are jointly seen as the next most underutilized, meaning space for deeper professional networking and community investment still remains.
- Newsletters (12.5%) are recognized as an underutilized owned channel, particularly relevant given the noise on social platforms.
Most Overhyped Channels
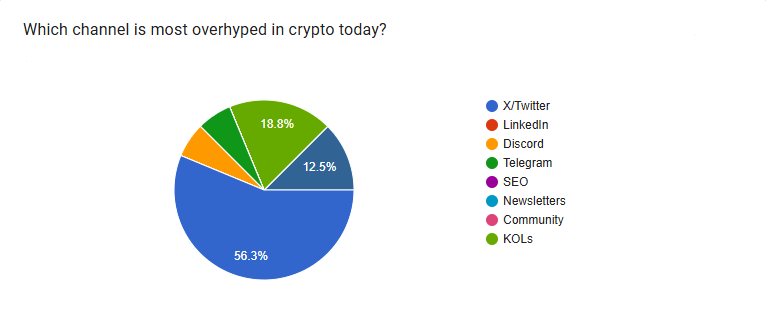
Participants were asked which channel they consider most overhyped relative to its actual marketing impact.
Key Observations
- X/Twitter is simultaneously the most used channel (93.8%) AND the most overhyped (56.3%), a paradox that reflects habitual use despite diminishing organic returns.
- KOLs are considered overhyped by 18.8% of respondents, raising questions about the ROI of influencer-led marketing in the current Web3 climate.
Channels Discontinued in the Past 12 Months
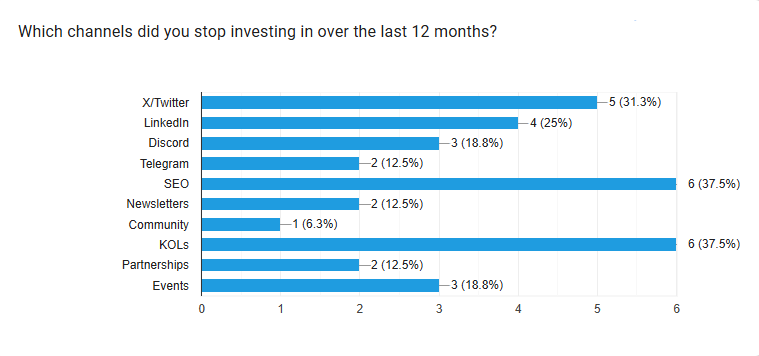
Participants identified channels they had stopped investing in, signaling where the sampled organizations have pulled back resources.
Key Observations
- SEO and KOLs are the most abandoned channels (37.5% each), suggesting either diminishing confidence in their effectiveness or resource constraints.
- X/Twitter shows a notable 31.3% abandonment rate despite 93.8% usage.
- Community is the least abandoned channel (6.3%), reinforcing its perceived longevity and core importance to Web3 strategy.
Highest ROI Channels
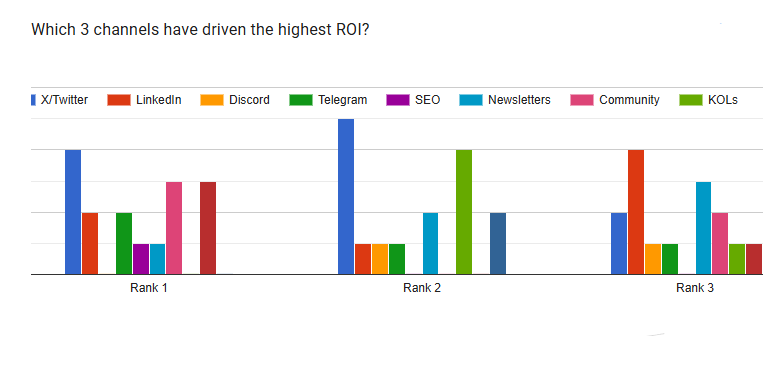
Respondents ranked their top 3 highest ROI channels. The data below reflects relative rankings based on observed frequency across Rank 1, 2, and 3 responses.
Key Observations
- X/Twitter consistently appears across all three ROI ranks, confirming it as a core revenue-contributing channel despite perceptions of overuse.
- Telegram and LinkedIn feature strongly in Rank 2 and Rank 3, respectively, suggesting they are valued for mid-funnel and professional-audience nurturing.
- Community ranks highly in Rank 1, reinforcing the view that community-led growth, though hard to scale, delivers strong returns when executed well.
Section 5: Positioning, Messaging & ICP
Ideal Customer Profile (ICP) Clarity
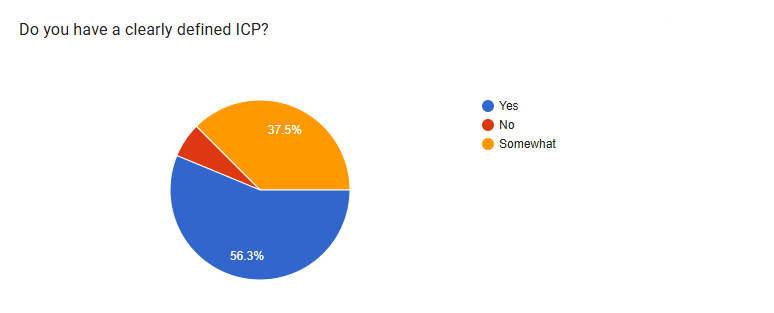
Key Observations
- 56.3% have a clearly defined ICP, meaning that just over half have done the audience segmentation work necessary for targeted marketing.
- 37.5% describe their ICP as only ‘somewhat defined’, a significant gap that may explain scattered channel strategies and inconsistent messaging observed elsewhere.
- Only 6.3% have no ICP at all.
Documented Positioning & Messaging Framework
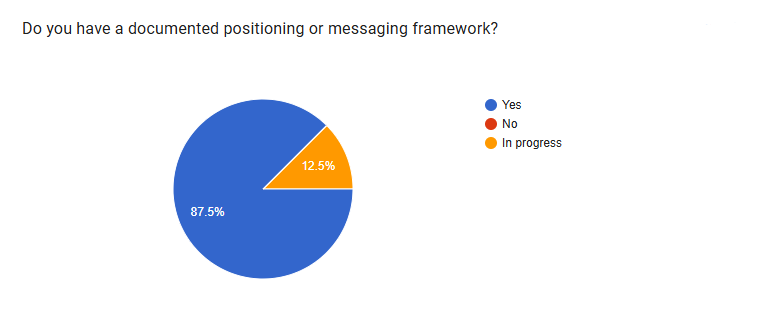
Key Observations
- An impressive 87.5% of respondents have a documented positioning or messaging framework, a notably high figure that may reflect the sophistication of these sampled organizations.
- 12.5% are in the process of building one, and no respondent reported having none, a positive indicator of strategic marketing maturity.
- While 87.5% have messaging frameworks, only 56.3% have clearly defined ICPs, suggesting some organizations are documenting messaging without a fully resolved audience strategy.
Section 6: Content Strategy
Content Formats Actively Produced
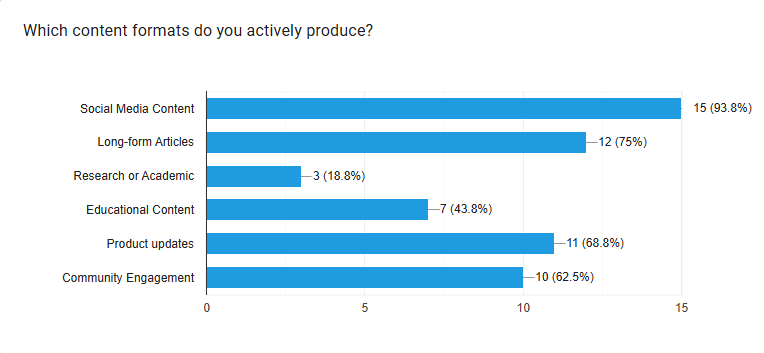
We asked participants which content formats they regularly produce. Multiple selections were permitted.
Key Observations
- Social media content is produced by 93.8% of respondents, as evident with the near-universal use of X/Twitter and LinkedIn in our survey.
- Long-form articles (75%) and product updates (68.8%) are the next most common.
- Research and academic content are produced by only 18.8%, a missed opportunity despite the trust-building potential of thought leadership and original research in the Web3 space.
Content Mix
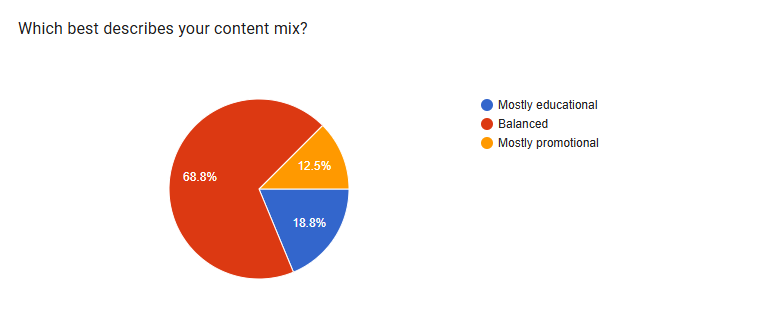
Key Observations
- 68.8% of respondents describe a balanced content mix that combines educational and promotional content.
- 18.8% skew toward education, consistent with Web3’s ‘build in public’ and community-first culture.
- Only 12.5% are primarily promotional, suggesting most organizations understand the importance of value-first content to sustain audience engagement.
Section 7: Trust & Brand Credibility
Trust Signals Publicly Emphasized
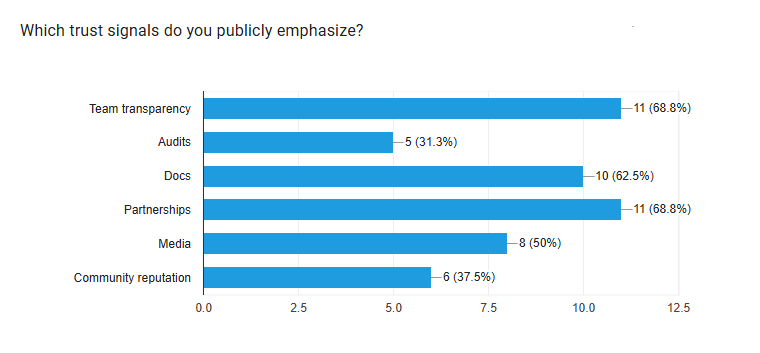
Participants were asked which trust signals they actively communicate publicly to build credibility with their target audiences.
Key Observations
- Team transparency and partnerships are the joint top trust signals at 68.8% each.
- Documentation is emphasized by 62.5% of respondents.
- Only 31.3% actively promote audits, despite security audits being a critical trust signal for users considering financial products, a notable gap.
Trust vs. Growth Speed Prioritization
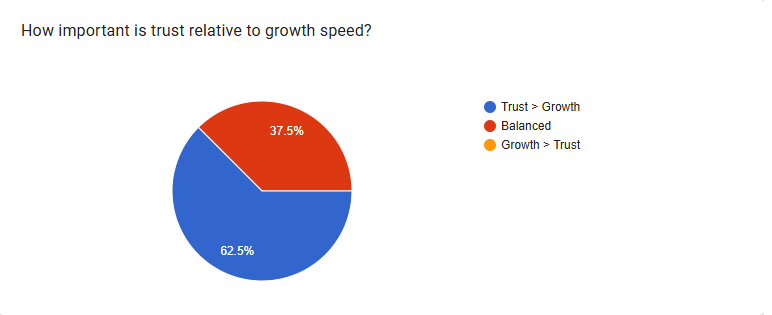
Key Observations
- 62.5% prioritize trust above growth speed, a mindset aligned with the long-term, community-centric nature of sustainable Web3 projects.
- 37.5% take a balanced approach, while zero respondents prioritize growth over trust.
Impact of Trust Concerns on Adoption
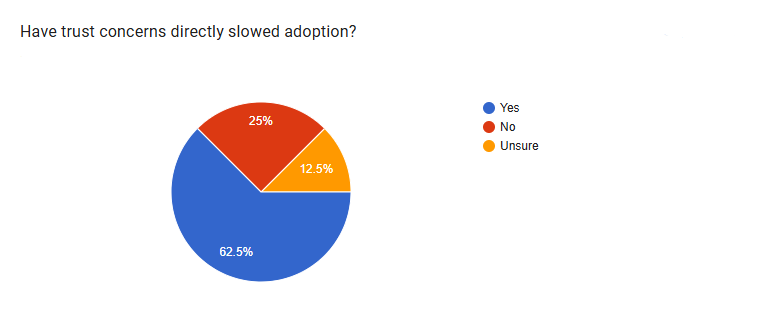
Key Observations
- 62.5% of respondents confirm that trust concerns have directly slowed their product adoption.
- Only 25% report that trust has not been a barrier to adoption, while 12.5% are unsure, together indicating widespread trust sensitivity in the ecosystem.
Section 8: Analytics, Tracking & Attribution
Marketing Funnel Tracking
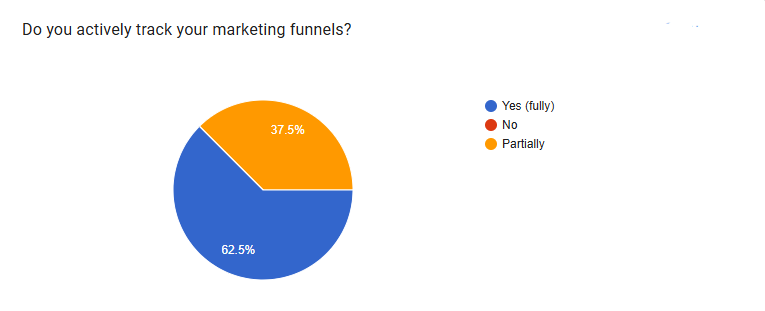
Key Observations
- 62.5% fully track their marketing funnels, a positive finding that indicates most respondents have invested in measurement infrastructure.
- 37.5% only partially track, revealing gaps in end-to-end visibility. No respondent reported zero funnel tracking.
Primary Conversion Metric (Hard CTA)
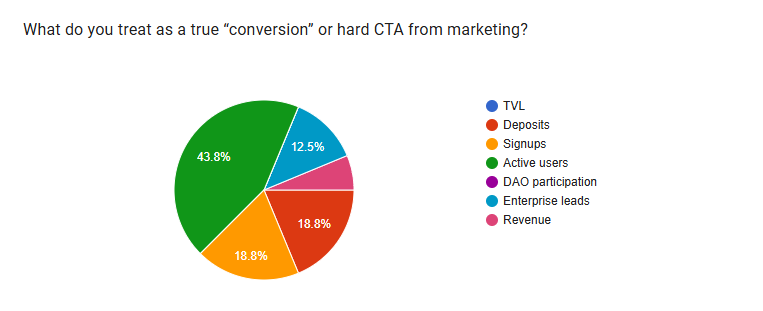
Respondents identified the primary metric they treat as a true ‘conversion’ from marketing activity.
Key Observations
- Active users are the dominant conversion metric at 43.8%, reflecting a product-led growth orientation where engagement is valued over pure financial inflow.
- Signups and deposits each account for 18.8%, meaning the sampled organizations treat transactional or registration actions as their north-star conversion.
- Enterprise leads at 12.5% suggest a B2B segment within the sample size that prioritizes pipeline generation over consumer engagement metrics.
Attribution Confidence
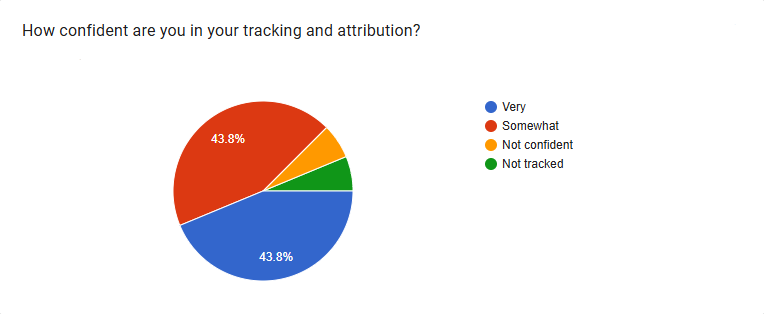
Key Observations
- 43.8% are very confident in their tracking and attribution, given the known challenges of on-chain and cross-platform attribution in Web3.
- An equal 43.8% are only somewhat confident, suggesting attribution remains a work-in-progress for most.
- Only ~12.4% of the combined report shows low confidence or no tracking at all.
Section 9: Community & Engagement
Primary Community Platform
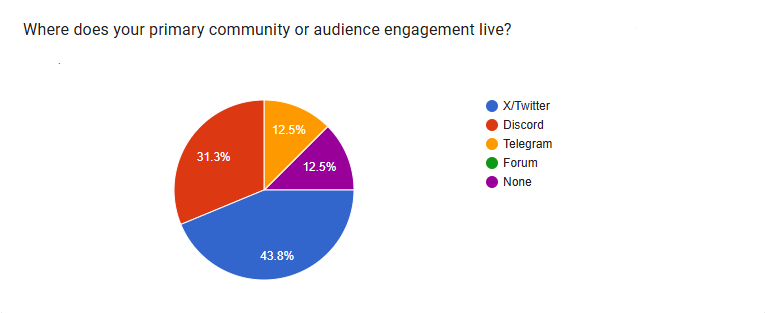
Key Observations
- X/Twitter leads as the primary community engagement hub at 43.8%, reinforcing its dual role as both a broadcast and community channel.
- Discord accounts for 31.3%, reflecting its continued relevance as a dedicated community infrastructure for Web3 projects.
- 12.5% of respondents report having no community platform.
Community Engagement Quality
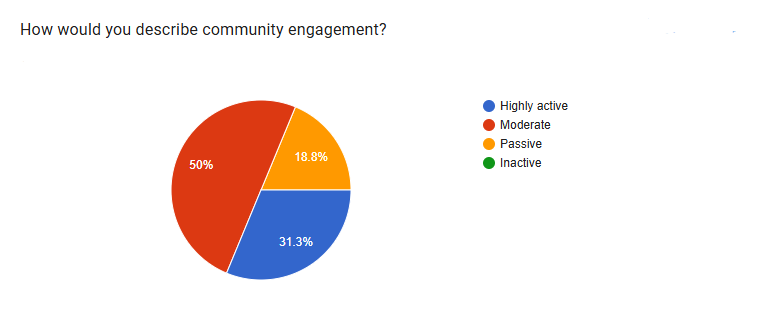
Key Observations
- 50% describe their community engagement as moderate, indicating functional but not particularly vibrant community dynamics for the majority.
- 31.3% report highly active communities, likely those investing consistently in moderation, events, and incentive structures.
- No respondent reported an inactive community.
Community Contribution to Business Growth
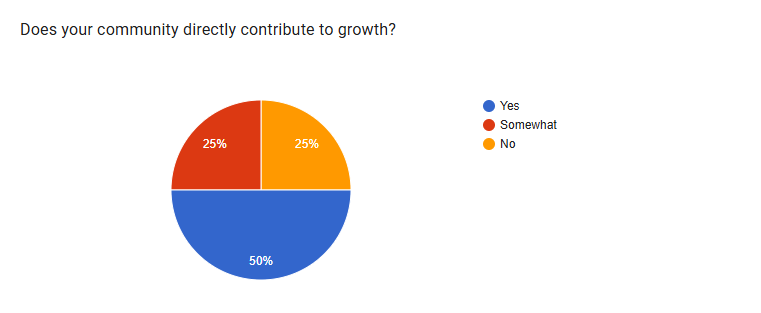
Key Observations
- 50% of respondents confirm their community directly contributes to business growth, a strong validation of community-led growth as a real commercial driver.
- 25% see only partial contribution, while another 25% see none, indicating that community ROI varies significantly depending on how it is structured, incentivized, and leveraged.
Community Growth Incentive Mechanisms
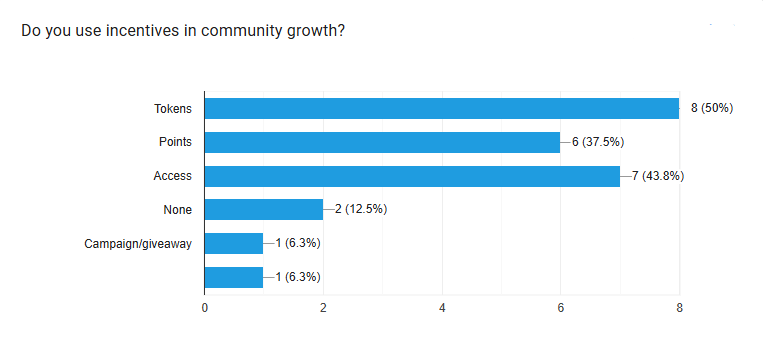
Participants indicated which incentive mechanisms they actively use to drive community growth. They were allowed to make multiple selections.
Key Observations
- Token-based incentives are the most common mechanism at 50%, leveraging native Web3 assets for community growth.
- Access-based incentives (43.8%) and points systems (37.5%) are also widely used.
- 12.5% use no incentives at all, suggesting these communities are growing entirely on content, culture, and product value.
Section 10: Tooling, AI & Marketing Maturity
Marketing Tools Actively Used
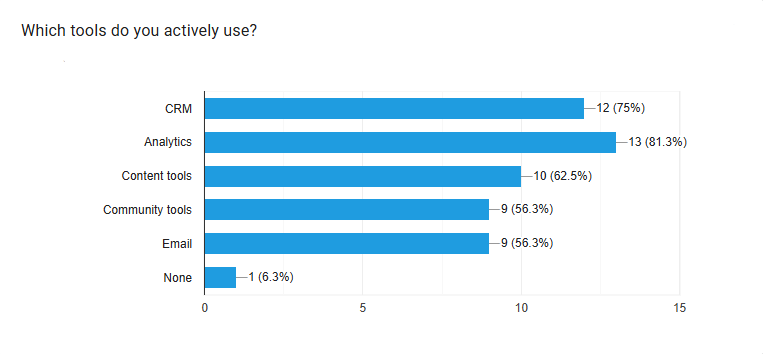
We asked our survey participants to identify the categories of marketing tools actively deployed across their organizations. Voting for multiple categories was allowed.
Key Observations
- Analytics tools are the most widely adopted at 81.3%, reflecting the measurement focus seen in the attribution data.
- CRM adoption at 75% is notably high, where user pseudonymity and on-chain interactions often complicate traditional CRM workflows.
- Content and community tools each see 50%+ adoption, consistent with the content-heavy and community-centric strategies described throughout the survey.
- Only 6.3% use no tools at all.
AI Usage in Marketing
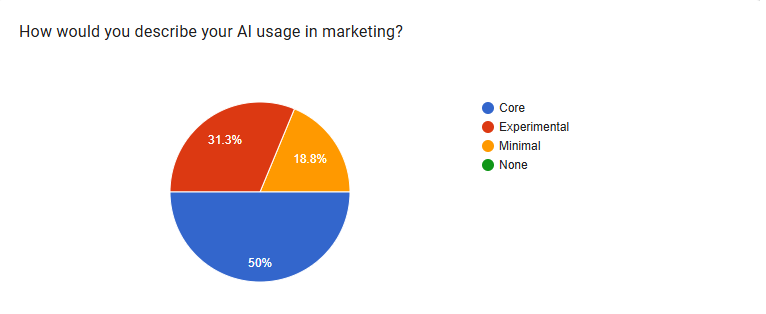
Key Observations
- 50% of respondents describe AI as core to their marketing operations.
- 31.3% are in experimental mode, suggesting active exploration and likely rapid adoption in the near term.
- Zero respondents report no AI usage, a clear signal that AI adoption in Web3 marketing has crossed the mainstream threshold.
Tooling Stack Self-Assessment
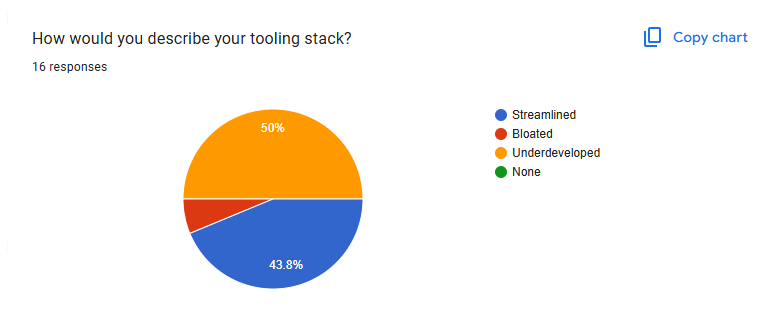
Key Observations
- 50% describe their tooling stack as underdeveloped, suggesting that despite high tool adoption rates, many organizations feel their stack is incomplete or not fit-for-purpose.
- 43.8% consider their stack streamlined, and only ~6.3% find it bloated, indicating that over-investment in tooling is not a common problem.
Overall Marketing Maturity
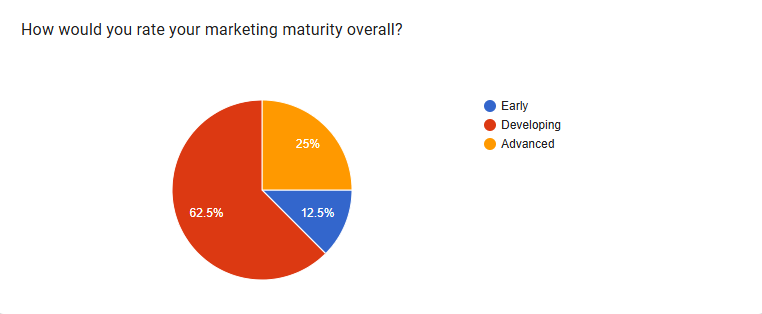
Key Observations
- 62.5% of respondents self-assess as ‘developing’ in marketing maturity, acknowledging progress but recognizing significant room for growth in strategy, execution, and measurement.
- 25% consider themselves advanced.
- Only 12.5% are at an early stage, consistent with the overall profile of a cohort that skews toward PMF and beyond.
Section 11: Key Bottlenecks & Strategic Challenges
Biggest Marketing Bottleneck
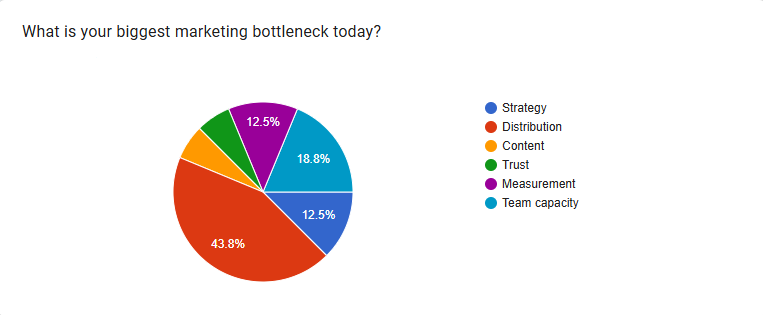
Participants were asked to identify their single biggest marketing bottleneck today, surfacing the most pressing constraints on growth and execution.
Key Observations
- Distribution is the single largest bottleneck at 43.8%, meaning the primary challenge for nearly half of respondents is not creating content or strategy, but getting it in front of the right audiences effectively.
- Team capacity is the second bottleneck at 18.8%, highlighting the resource constraints that limit execution for organizations operating lean marketing teams.
- Measurement and strategy each account for 12.5%, suggesting a meaningful minority are still grappling with foundational planning and ROI visibility challenges.
- Content and trust, as bottlenecks, each represent approx 6.2%, indicating they are not primary constraints for most, though they remain active concerns in the ecosystem.
Conclusion & Strategic Takeaways
The data from this survey of these Web3 organizations paints a detailed picture of a maturing but still evolving ecosystem. The following strategic themes emerge from the analysis:
1. The Market is post-PMF but Budget-Constrained
With 43.8% of respondents at the PMF stage and 43.8% reporting budget decreases in the past 12 months, the sampled organizations are at a critical inflection; validated, but operating under financial pressure. Efficient, high-ROI channels are non-negotiable.
2. X/Twitter is Habitual
Nearly every organization is on X/Twitter (93.8%), yet it is simultaneously considered the most overhyped channel (56.3%). This paradox suggests the platform is used by default rather than deliberate allocation. Rebalancing toward undervalued channels like SEO and LinkedIn could yield outsized returns.
3. Distribution is the Core Bottleneck
43.8% identify distribution as their biggest marketing challenge. Most are producing content (social media at 93.8%), but getting it to the right audiences remains the unsolved problem. Making channel strategy and partnership development mission-critical priorities.
4. Trust is a Commercial Issue
62.5% confirm that trust concerns have directly slowed product adoption. Combined with the finding that 62.5% prioritize trust over growth speed. It is clear that credibility, through team transparency, partnerships, documentation, and audits, is a core go-to-market lever, not a nice-to-have.
5. AI Adoption is Real and Accelerating
50% of respondents describe AI as core to their marketing operations, a majority. Web3 marketing teams are early and enthusiastic adopters of AI tooling, which may be a key driver of efficiency in resource-constrained environments.
6. Marketing Maturity is Developing
62.5% self-assess as ‘developing’ in marketing maturity. While foundations are in place, such as messaging frameworks (87.5%), funnel tracking (62.5%), and analytics tools (81.3%), the path to advanced maturity lies in clarifying ICP, improving attribution, and addressing the distribution challenge.